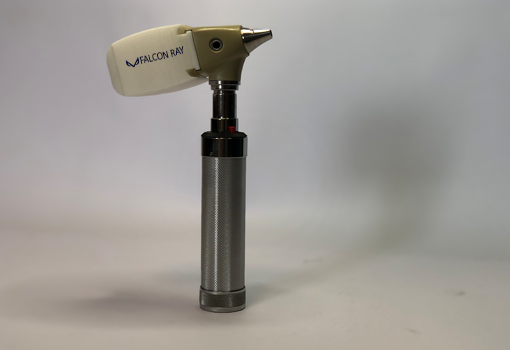
Hein and Welch Allyn otoscopes are being widely used in a diversity of general practices with perfect optical precision and light performance. Thus their only lack could mentioned to be documentation of GP or ENT specialist observations, Falcon Ray digital upgrades for otoscopy converts your conventional otoscope devices easily in to their state of the art mode. Easily connect the digitizer module to your otoscope in order to plug and play the USB with an autorun software to capture images by a simple foot switch and record your video framesets for detailed referral and archiving purposes!

General Practices and Optometry
GP and Optometry practices are those front liners to primarily identify peripheral, internal, respiratory, cognitive and ophthalmic conditions of patients and make correct referrals to their specialist or provide the essential care. Diagnostic equipment in this era is therefore considered to act as a crucial role player in quality and accuracy of care. Optimum clinical data operations ergonomics of such tools are those values on which Falcon Ray General Care equipment are designed and manufactured on!
Otoscope Digital Upgrade
High Depth Perception
Realtime Image Adjustment
Image Capture Foot Switch
Autorun Acquisition Software
USB2 Connection to Host
2MP 10Bits Quality at 24Fps
High Clinical Ergonomy
Easy and Fast Installation
Easily Detachable to Normal
High CTP Ratio
Digital Optometry Diagnostic Charts
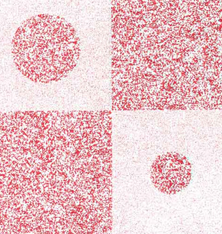
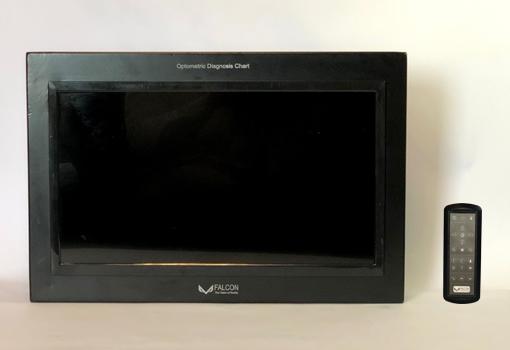
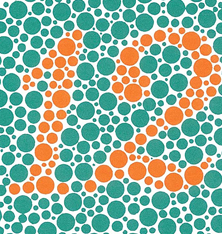
Falcon Ray Optometry Diagnostic LCD Chart provides a complex of optometric tests in a single easy to use digital solution with high quality display to avoid patients false diagnostics. Along with an ergonomic remote control coded for each device with, it comes an alternative one and both rechargeable. The chart contains the Snellen charts of E, C and Numbers, Dr. Ishihara and TNO tests, Macular Degeneration and Stereo Vision test, Animation, Kids and Accessories test, as well as a Slide Set of ocular structure and defects for the optometrist to visually describe ophthalmic issues for patients.
Distance Adjustment (m)
Brightness Adjustment (RG)
3 Snellen Tests (E, C and Num)
Dr. Ishihara and TNO Tests
MD and Stereo Vision Tests
Animation, Kids and Addition
Ocular Description Area
2 Rechargeable Controls
High Quality Display
Easy to Install and Use
Digital Displays for Optometry Diagnosis
Almost any monitor is capable to visualize an image from an old CRT to a high end EIZO marvelous display. For an observer to view the truth though, displays are quaite fair discriminated with complex metrics. Some of whys and whats to identify the quality factors may better to be outlined, for the optometrist to understand the requirements for a digital display to be used as an Optometry Diagnostic Chart.
Once the visual data is sent to a display, it takes a diversity of factors in challenge for quality for each single photon to reach its destination to human ocular system. For an image to be correctly observed without any eye affection and misunderstanding. Such factors as the Backlight, Polarizers, Pixel and Common Electrodes, the TFT, Color Filters and Glass Substrates are all supposed to be in their standards to deliver the mentioned quality. Otherwise the image reconstruction chip and electronic circuitry, power supply are those alternative elements that must meet their specific standards.
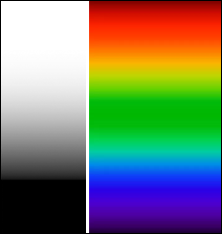
There are many displays that are capable of visualizing color and greyscale images; however to what extent they are able to discriminate between colors and gray levels, or how diverse they can go in gray levels and color diversity, as well as the natural rendering extent of them make one distinction from the others. All these would be feasible with specific and standard hardware and microelectronics to optimize Gamma, Dynamic Range, Brightness and Contrast, Color Temperature and Black Level. Although quality metrics are mostly summarized into resolution for most users.
Optical illusions may situate once viewing displays due to either the content being shown or the lack of display quality. In case a display quality metrics are not meeting their required standards, even eye affection could occur. Otherwise once the patient is trying to be diagnosed by a specific test, false negatives or false positives may likewise happen. It is therefore beleived that more considerations than the display resolution might be critical to consider when a display being chosen for an optometry diagnostic chart; parameters impacting color gamut or greylevel, as with photonics technology.
Probably the best solution for a Snellen chart to be used to measure a person’s visual strength would be when it is printed on paper and the test is being conducted outdoor in day light. Conventional projectors use low frequency power source to light up their charts and the new LED technology employs a multichromatic visualization of data that could impact the accuracy of test as well. Digital displays have their own liabilities as well. It is thus important for a display to meet the required standards in terms of photonics and microelectronics technology to avoid false diagnosis.

